1 Fundamentals of Rheology: Deformation and Flow
Why does honey flow so much more slowly than water? A visual introduction to shear stress, shear rate and viscosity, starting from the kitchen and ending at the Two-Plate Model.
Tip a spoonful of water and a spoonful of honey at the same time. The water is gone in a moment. The honey takes its time, forming a thick, glossy ribbon that slowly piles up in the glass. Both are liquids, both flow – and yet something inside the honey resists motion far more strongly.
That “something” is what this article is about. It is the starting point of rheology, the science of how materials deform and flow. Rheology explains why ketchup needs a shake, why paint does not drip off the wall, and why a piece of adhesive tape sticks at all. You do not need any prior knowledge: we start in the kitchen and build up the physics step by step.
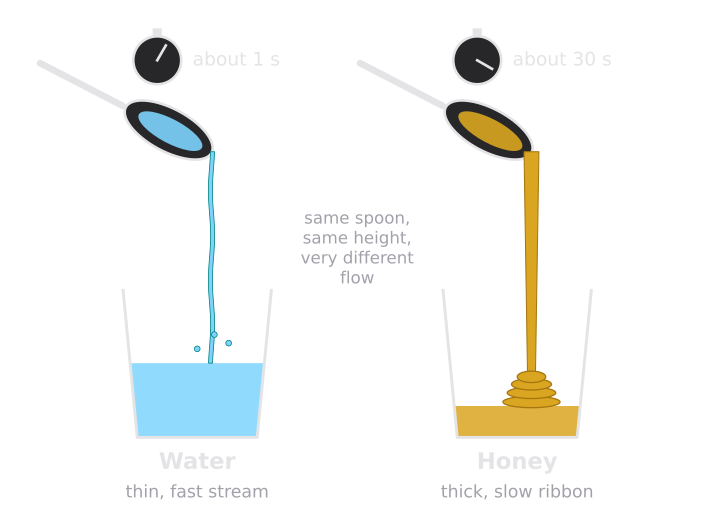
What to look for: same spoon, same height, very different flow. The difference lies entirely inside the liquid.
What Makes Honey Slower Than Water?
Imagine a liquid as a deck of playing cards lying on a table. Put your hand on the top card and push it forward. The top card moves the most, the card below it a little less, and so on down to the bottom card, which stays on the table. Every card slides a little over its neighbor.
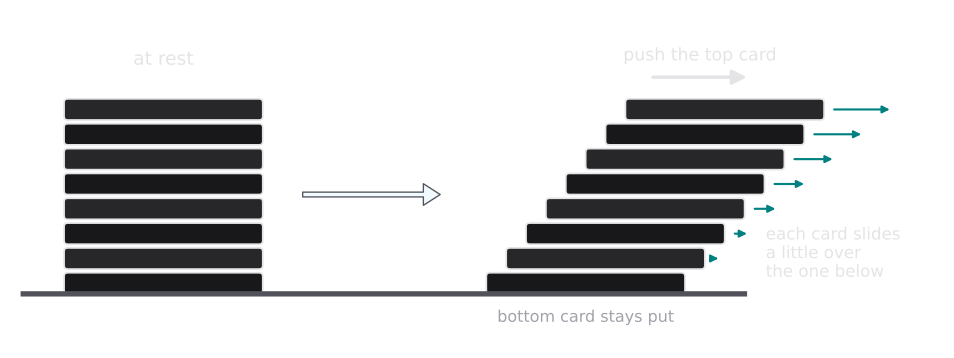
What to look for: the teal arrows grow from bottom to top. Each layer moves a bit faster than the layer beneath it.
Between every pair of cards there is friction. The more friction, the harder you have to push to keep the deck moving. A flowing liquid behaves in the same way: it moves in thin layers that slide over one another, and between these layers there is a kind of internal friction. In water this internal friction is tiny. In honey it is thousands of times larger. This internal friction has a name: viscosity.
Try it at home – the liquid race: Put one teaspoon each of water, cooking oil, syrup and honey at the top of a tilted cutting board and measure how long each one needs to run 20 cm. Then place the honey jar in warm water for ten minutes and repeat the race. You have just measured, in a simple way, how viscosity depends on the liquid – and on temperature.
The Two-Plate Model: Rheology’s Reference Experiment
To measure viscosity, we need a clean version of the deck-of-cards picture. This is the Two-Plate Model, the idealized experiment behind every rheometer.
A thin liquid layer of thickness sits between two parallel plates. The lower plate is fixed. The upper plate has the contact area and is pulled by a force , so that it moves at a constant speed . The liquid sticks to both plates: the layer touching the lower plate stays at rest, the layer touching the upper plate moves with it, and every layer in between moves a little faster than the one below.
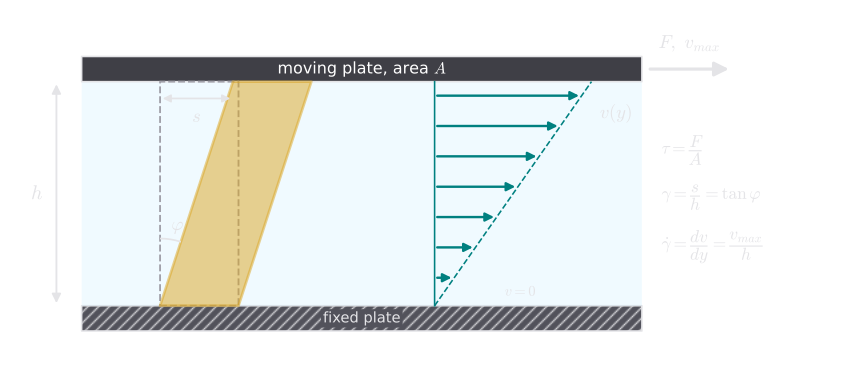
What to look for: the velocity arrows increase in a straight line from zero to . A small rectangle of liquid (dashed) is tilted into a parallelogram (goldenrod) – this tilt is the deformation.
From this simple set-up we get three quantities that everything else in rheology is built on: shear stress, shear rate and viscosity.
Shear Stress: The Push Along a Surface
Our everyday idea of “pushing” is usually pressing: the force acts perpendicular to a surface, as when you press a book onto a table. In rheology, the important force acts along the surface, the way your hand drags the top card of the deck.
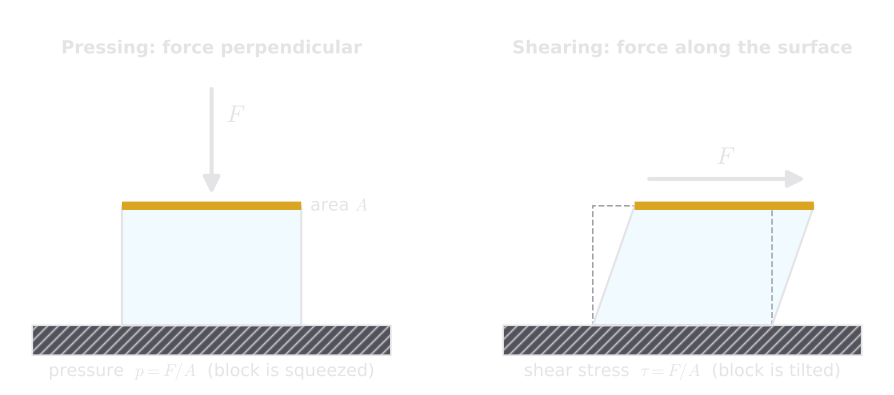
What to look for: the same force on the same area – but pressing squeezes the block, while dragging tilts it.
The force per unit area acting along the surface is the shear stress:
In words: the shear stress (Greek “tau”) is the force in newtons divided by the area in square meters over which it acts. Its unit is the pascal: .
A pascal is a small unit: a sheet of paper lying on a table presses on it with about 1 Pa. Typical shear stresses in rheometers range from a thousandth of a pascal to several hundred thousand pascals.
Shear Strain and Shear Rate: How Far and How Fast
When the upper plate moves by a distance , the liquid element in the figure is tilted. How strongly it is tilted is the shear strain:
In words: the shear strain (Greek “gamma”) is the displacement of the upper plate divided by the gap . It has no unit and is often given in percent. A displacement of 1 mm across a 1 mm gap means or 100 %.
For a solid, the strain is the whole story: push it, and it deforms by a certain amount and stops. For a liquid, the strain keeps growing as long as the plate keeps moving – after one minute of shearing it can be in the thousands. What really characterizes the flow is not how far the liquid has been deformed, but how fast. This is the shear rate.
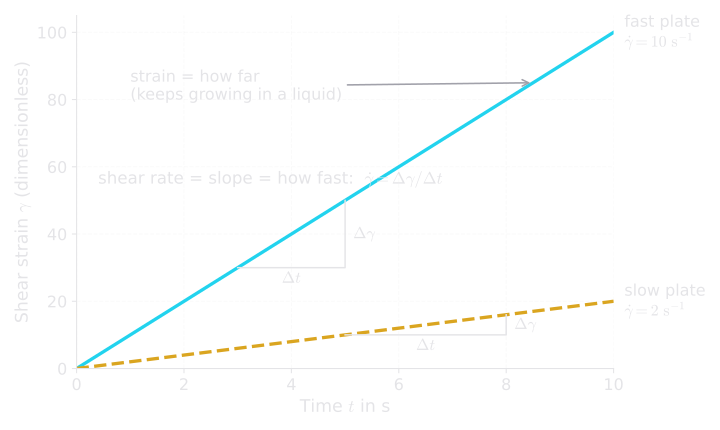
What to look for: the strain rises steadily for both plates. The steeper line belongs to the faster plate – the slope is the shear rate.
The shear rate is the change of strain per unit time. It can be derived in three short steps:
- At every height , the liquid layer has moved by a distance . The strain is the local slope of this displacement: .
- The shear rate is how quickly the strain changes with time: . The dot above the is the physicist’s shorthand for “rate of change”.
- The order of the two derivatives may be swapped, and the change of position with time, , is simply the velocity of the layer. So:
In words: the shear rate (“gamma dot”) is the change in velocity from one layer to the next, divided by their distance. Its unit is (“per second”).
In the Two-Plate Model the velocity grows in a straight line from zero to across the gap, so the shear rate is simply
A shear rate of means: every second, the top of the layer moves ten gap-thicknesses further than the bottom.
Viscosity: Internal Friction in Numbers
Now we can put cause and effect together. The shear stress is the cause (how hard we push), the shear rate is the effect (how fast the liquid flows). Their ratio is the viscosity:
In words: the viscosity (Greek “eta”) tells us how much shear stress is needed for each unit of shear rate. Its unit is pascal-second, Pa·s. You will often see millipascal-seconds: . The older unit centipoise (cP) is identical to mPa·s.
Worked example. Honey fills a 1 mm gap. The upper plate, with an area of , is pulled at 10 mm/s by a force of 0.05 N.
- Shear rate:
- Shear stress:
- Viscosity: – a typical honey.
Rearranging the three definitions gives the force needed to drive the plate:
In words: doubling the viscosity, the plate area or the speed doubles the force; halving the gap also doubles it. With water () instead of honey, the same experiment needs only 0.01 mN – five thousand times less force.
Quick check: You shear two liquids in the same set-up at the same speed. Liquid A needs a force of 2 N, liquid B a force of 6 N. Which has the higher viscosity, and by how much? Answer: liquid B, three times higher – with identical geometry and speed, force and viscosity are proportional.
Newton’s Law of Viscosity
For water, oils, solvents, glycerol and honey, something simple happens when you change the speed: double the shear rate and you need exactly double the shear stress. The viscosity stays the same, no matter how fast you shear or how long. This is Newton’s law of viscosity:
In words: shear stress and shear rate are proportional; the viscosity is the constant of proportionality. Liquids that follow this law are called Newtonian or ideally viscous.
Plotting shear stress against shear rate gives a flow curve. For a Newtonian liquid, it is a straight line through the origin, and its slope is the viscosity.
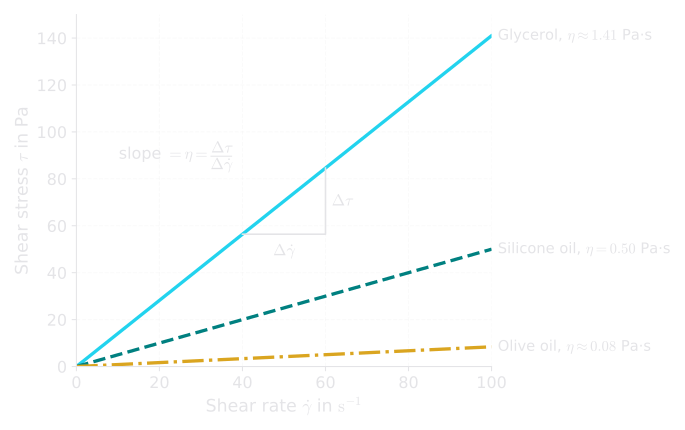
What to look for: three straight lines. The steeper the line, the higher the viscosity. Water would be about 1,400 times flatter than glycerol and would lie practically on the horizontal axis.
This also explains the straight velocity profile in the Two-Plate Model. In a steady flow, every layer must pass the same shear stress on to the next one – otherwise some layers would speed up or slow down. If the stress is the same everywhere and the viscosity is constant, then is the same everywhere too. The velocity therefore changes by the same amount from layer to layer: a straight line from zero to .
Many important materials are not Newtonian: ketchup, paint, blood, yogurt, polymer melts and adhesives change their viscosity with the shear rate or with time. They are the subject of the next article.
From Air to Mountains: How Big Is Viscosity?
Viscosity covers an astonishing range. Between air and the rock of the Earth’s mantle lie about 26 powers of ten. That is why rheologists almost always use logarithmic scales, where each step on the axis means “ten times more”.
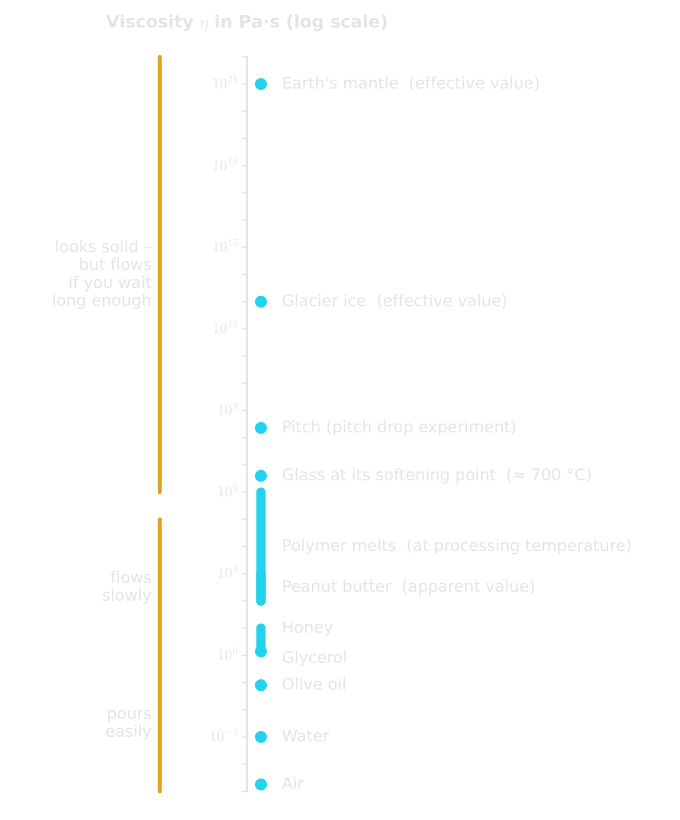
What to look for: everything on this ladder flows. For the materials at the top, “flowing” simply takes years – or millions of years.
| Material (about 20 °C) | Viscosity | Compared with water |
|---|---|---|
| Air | ≈ 0.018 mPa·s | ≈ 1/55 |
| Water | ≈ 1.0 mPa·s | 1 |
| Olive oil | ≈ 80 mPa·s | ≈ 80 × |
| Glycerol | ≈ 1.4 Pa·s | ≈ 1,400 × |
| Honey | ≈ 2–10 Pa·s | ≈ 2,000–10,000 × |
| Pitch (bitumen) | ≈ Pa·s | ≈ 200 billion × |
Everyday example – the pitch drop experiment: In 1927, a physics professor at the University of Queensland in Australia poured heated pitch into a sealed funnel. After the pitch had settled for three years, the funnel was opened at the bottom in 1930. Pitch looks like a hard, brittle solid – you can shatter it with a hammer. Yet it drips: roughly one drop falls every decade, and only nine drops have fallen since the experiment began. From the dripping speed, its viscosity was estimated at around Pa·s, tens of millions of times that of honey. Whether a material looks solid or liquid depends on how long you are willing to watch – an idea we will meet again when we discuss viscoelasticity.
Temperature: The Hidden Variable
Warm honey flows much more easily than cold honey. For many liquids, the viscosity drops steeply as the temperature rises, because the molecules move faster and slide past each other more easily. A widely used description is the Arrhenius law:
In words: the viscosity decreases exponentially with increasing absolute temperature (in kelvin). is the gas constant, a material constant, and the activation energy describes how strongly the material reacts to temperature. The higher , the more sensitive the liquid.
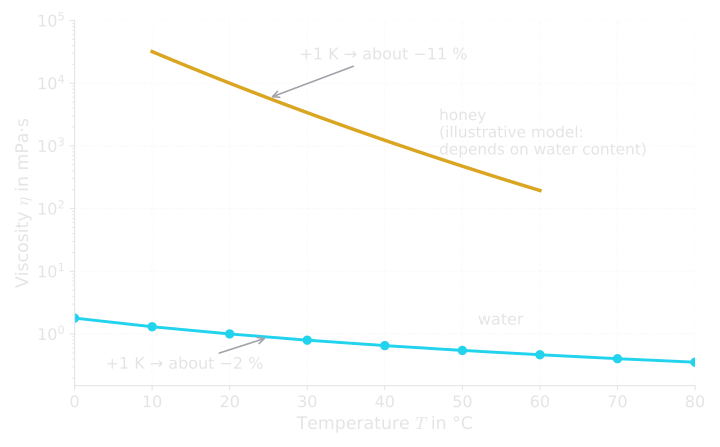
What to look for: on a logarithmic axis, the slope shows the relative change. The honey line is far steeper – honey reacts much more strongly to temperature than water does.
In the lab: Water loses about 2 % of its viscosity per kelvin near room temperature, honey more than 10 %. A temperature error of just 1 K can therefore falsify a honey measurement by over 10 %. This is why rheometers control the sample temperature to about ±0.1 K – and why every viscosity value is meaningless without the temperature at which it was measured.
The Dashpot: A Symbol for Pure Flow
Engineers like to represent material behavior with simple mechanical symbols. The symbol for an ideal viscous liquid is the dashpot: a piston moving through a cylinder filled with oil. You know dashpots from everyday life – a door closer, a car’s shock absorber, the soft-close lid of a toilet seat.
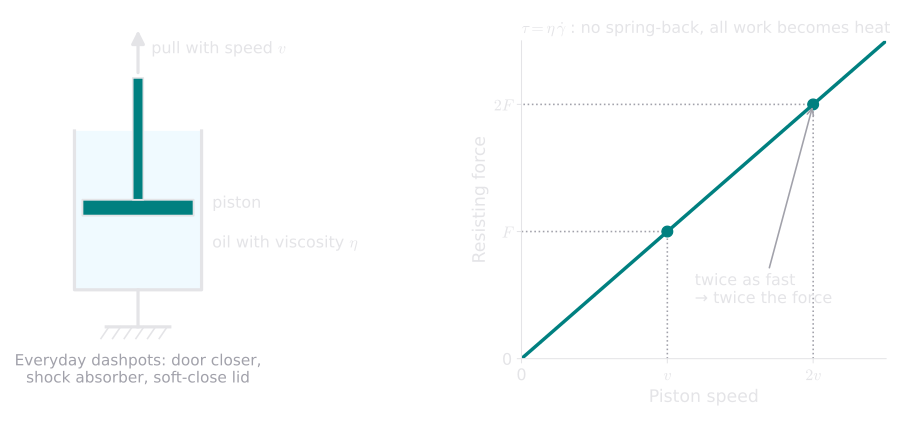
What to look for: the resistance depends only on the speed. Stop pulling and the piston simply stays where it is – there is no spring-back.
A dashpot has two characteristic properties:
- The faster you move it, the more it resists – exactly Newton’s law, .
- It has no memory. Once you stop, it stays where it is. All the work you put in is converted into heat.
The heat produced per second and per cubic meter of liquid is
In words: the dissipated power grows with the square of the shear rate. At high shear rates this matters: a liquid with a viscosity of 1 Pa·s sheared at produces – without cooling, it would warm up by roughly a third of a degree every second.
The dashpot will be one of the two building blocks of our series. In Article 3 we meet the other one – the spring, the symbol of elasticity – and in Article 4 we combine the two to describe materials that are neither purely liquid nor purely solid.
How It Is Measured in Practice
The Two-Plate Model only gives correct viscosity values if four conditions are met:
- Laminar flow: the liquid must move in orderly layers, without swirls or turbulence. For slow flows and thin gaps this is almost always the case.
- No wall slip: the liquid must stick to both plates. If it slides along a wall, the measured viscosity is too low.
- Homogeneous sample: no air bubbles, no settling particles, no separation during the measurement.
- Constant temperature: as we have seen, even small temperature changes shift the result.
Common pitfall – wall slip: Pastes, gels, creams and highly filled materials often form a thin, low-viscosity layer at smooth walls and slide on it, like a bar of soap on a wet tile. The rheometer then measures this thin layer instead of the material itself. Roughened or profiled measuring surfaces help.
Real rheometers do not pull flat plates across a table. They rotate a cone, a plate or a cylinder, which creates the same kind of shear flow in a narrow gap. How the instrument turns torque and rotational speed into shear stress and shear rate is explained in the next article.
There is one more reason why a single viscosity value is rarely enough. Everyday and industrial processes shear materials at very different rates – from particles slowly settling in a bottle to adhesives being coated at high speed:
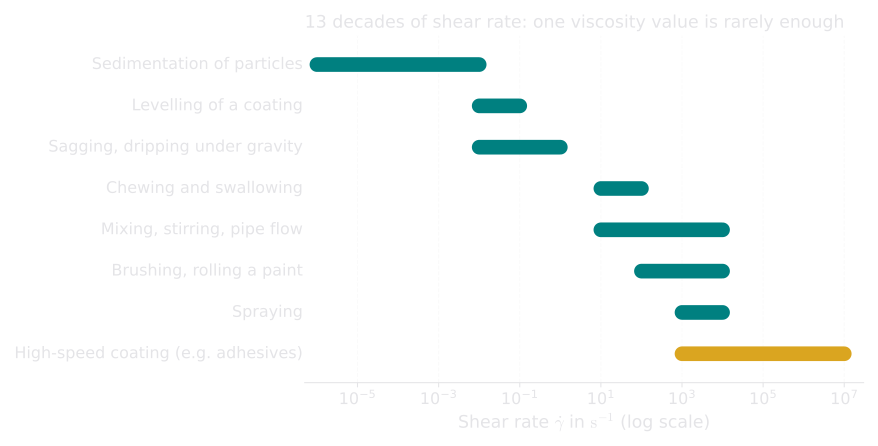
What to look for: the processes span 13 powers of ten. A material that is not Newtonian can have a completely different viscosity at each of these rates. (Values after Mezger, The Rheology Handbook.)
Where the deck-of-cards picture breaks down: a real liquid has no separate layers; its velocity changes smoothly across the gap. And unlike friction between cards, viscous friction does not depend on how hard the layers are pressed together – it comes from molecules carrying momentum from one layer into the next.
Why It Matters for Adhesives
This series leads step by step to a practical goal: understanding pressure-sensitive adhesives – tapes, labels, protective films – through their rheology. Two ideas from this article will come back:
- Sticking needs flow. When you press a tape onto a surface with your finger, the adhesive has only a few seconds to flow into the tiny hills and valleys of that surface. An adhesive that cannot flow at all cannot make contact – and will not stick.
- Peeling needs internal friction. When a tape is peeled off, the dashpot-like part of the adhesive turns the peeling work into heat. The more energy it dissipates, the harder the tape is to remove.
In Article 8 both effects come together in the Chang Viscoelastic Window, a map that tells us what kind of adhesive we are dealing with.
Key Takeaways
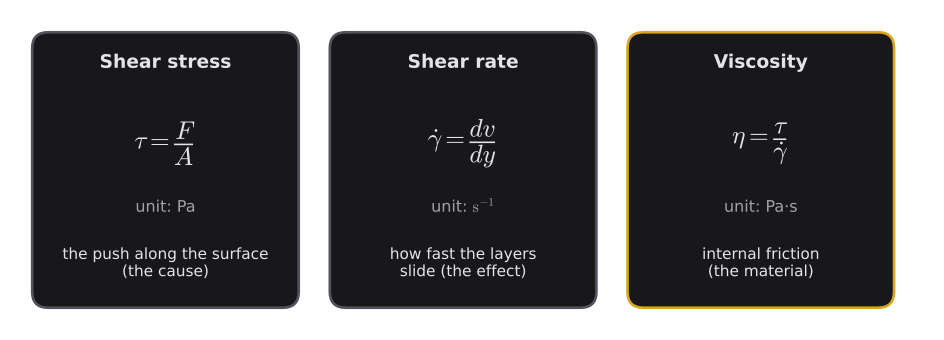
- A flowing liquid moves in thin layers that slide over one another. Viscosity is the internal friction between these layers – honey has thousands of times more than water.
- Shear stress is the cause, shear rate the effect, and viscosity describes the material in between.
- Strain tells you how far a material has been deformed, shear rate how fast. For liquids, “how fast” is what counts.
- A Newtonian liquid has a single viscosity at a given temperature; its flow curve is a straight line through the origin. Its symbol is the dashpot.
- Viscosity spans more than 25 powers of ten and depends strongly on temperature – every value needs its temperature.
- Adhesives must flow a little to stick, and dissipate energy to resist peeling – the first steps toward the Chang window.
Key Terms
| Term | Meaning in plain language | Symbol, unit |
|---|---|---|
| Rheology | The science of deformation and flow | – |
| Shear stress | Force per area acting along a surface | , Pa |
| Shear strain | How far a material has been tilted | , – or % |
| Shear rate | How fast the deformation grows; velocity change across the gap | , |
| Viscosity | Internal friction; resistance to flow | , Pa·s |
| Newtonian liquid | Liquid whose viscosity does not depend on the shear rate | – |
| Flow curve | Plot of shear stress against shear rate | |
| Dashpot | Mechanical symbol for an ideal viscous liquid | – |
| Two-Plate Model | Idealized shear experiment between a fixed and a moving plate | – |
Coming Up Next
Honey and water are the easy cases. Ketchup refuses to leave the bottle until you shake it, and a mixture of cornstarch and water turns hard when you punch it. In Part 2 we look at such non-Newtonian liquids, find out how a rotational rheometer measures them, and learn to read the curves that describe them.
References
- Mezger, T. G.: The Rheology Handbook, 5th ed., Vincentz Network, Hanover 2020.
- Macosko, C. W.: Rheology: Principles, Measurements, and Applications, Wiley-VCH, New York 1994.
- Morrison, F. A.: Understanding Rheology, Oxford University Press, New York 2001.
- Edgeworth, R.; Dalton, B. J.; Parnell, T.: The pitch drop experiment, European Journal of Physics 5 (1984) 198–200.