2 Rotational Rheometry: Flow Behavior and Characterization
Why does ketchup need a shake, why does oobleck turn hard when you hit it, and why does paint stop dripping? How a rotational rheometer measures flow behavior – and how to read the curves.
Ketchup is a stubborn liquid. Turn the bottle upside down and nothing happens – but give it a firm shake and it suddenly runs, often more than you wanted. A mixture of cornstarch and water, known as oobleck, does the exact opposite: stir it slowly and it flows like a liquid, hit it hard and it feels like a solid. And wall paint adds yet another twist: it spreads easily under the brush, yet a moment later it stops dripping down the wall.
In Part 1 we met liquids such as water and honey that have one viscosity. Most materials in daily life are not that simple. Their viscosity changes with how fast they are moved – and sometimes with how long. This article shows how a rotational rheometer measures such behavior and how to read the curves it produces.
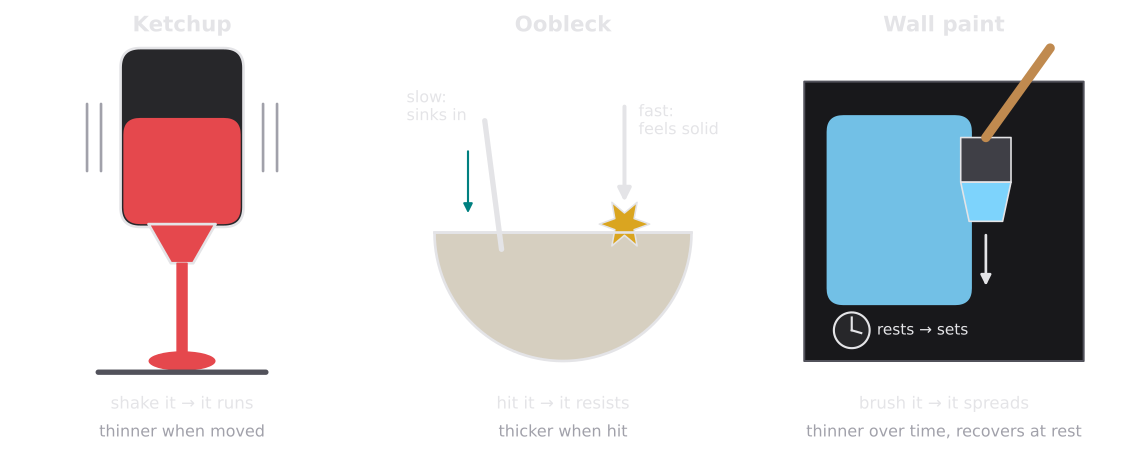
What to look for: three materials, three different answers to the same question – what happens to the viscosity when you move the material faster, or for longer?
Three Surprising Liquids
The three examples above stand for the three main types of non-Newtonian behavior:
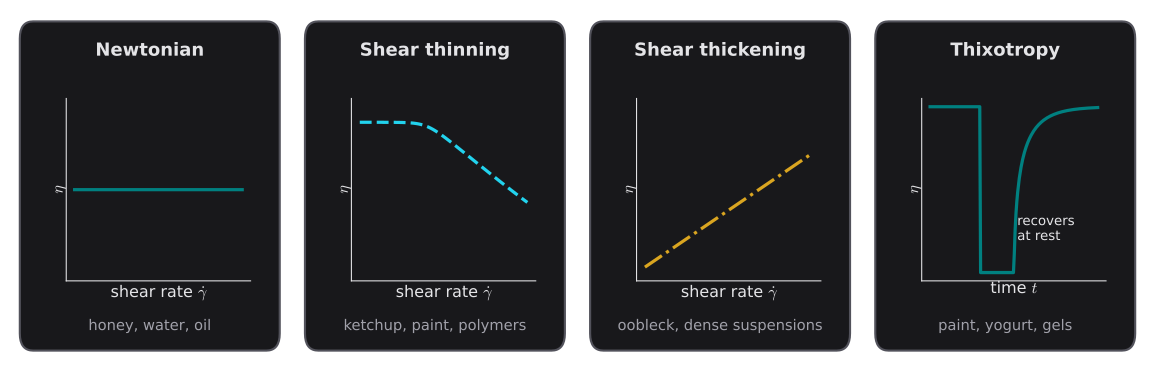
- Ketchup gets thinner when moved. Shaking or squeezing shears the ketchup, and its viscosity drops sharply. This is called shear thinning. Most everyday materials behave this way: paint, shampoo, toothpaste, yogurt, blood, polymer melts and adhesive solutions.
- Oobleck gets thicker when hit. At low speed it flows, at high speed it resists. This is called shear thickening. It is much rarer and typical of very densely packed suspensions.
- Paint changes with time. While you brush, its structure breaks down and it becomes thinner; at rest, the structure slowly rebuilds and the paint “sets” again. This time-dependent behavior is called thixotropy.
Try it at home – oobleck: Mix two parts cornstarch with one part water in a bowl. Slowly push a spoon into it: it sinks like into thick cream. Now hit the surface with the spoon: it bounces off as if the bowl were full of clay. Pick up a handful and roll it into a ball between your palms – as long as you keep rolling it stays firm; stop, and it melts through your fingers.
To describe such materials, one viscosity value is no longer enough. We need the viscosity as a function of the shear rate – and that is exactly what a rotational rheometer measures.
How a Rotational Rheometer Works
A rotational rheometer turns the Two-Plate Model from Part 1 into a practical instrument. Instead of pulling a flat plate, it rotates a precisely shaped measuring geometry over a sample that fills a narrow gap.
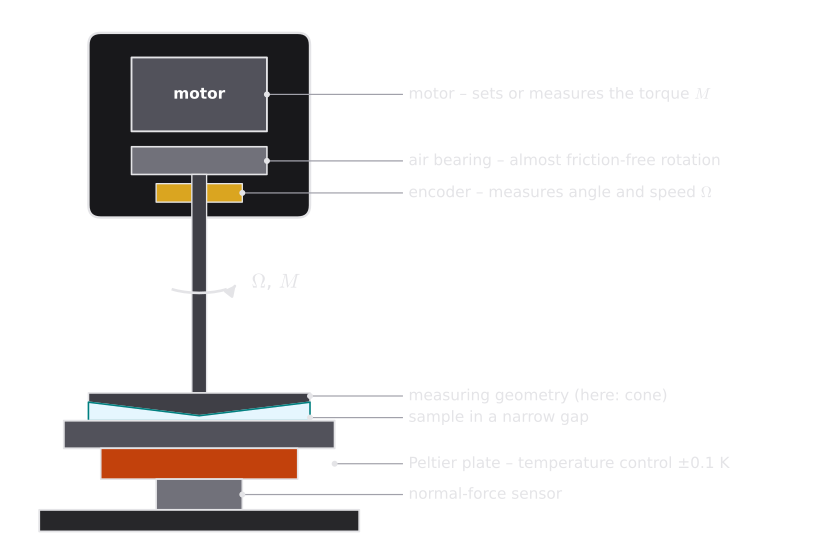
What to look for: the instrument only turns a shaft. Everything we learn about the material comes from how hard the motor has to twist and how fast the shaft turns.
The rheometer does not directly measure shear stress or shear rate. It measures two mechanical quantities at the drive:
- the torque (how hard the motor twists, in N·m), and
- the angular velocity (how fast the geometry turns, in rad/s).
Both are converted into rheological quantities with geometry factors that depend only on the shape and size of the measuring system:
In words: the torque tells us the shear stress, the rotational speed tells us the shear rate, and their ratio – corrected by the geometry – gives the viscosity. has the unit , is dimensionless.
Two Ways to Ask the Question: CSR and CSS
A rheometer can run in two basic modes. It can set the speed and measure how much torque is needed, or it can set the torque and measure how fast the geometry turns.
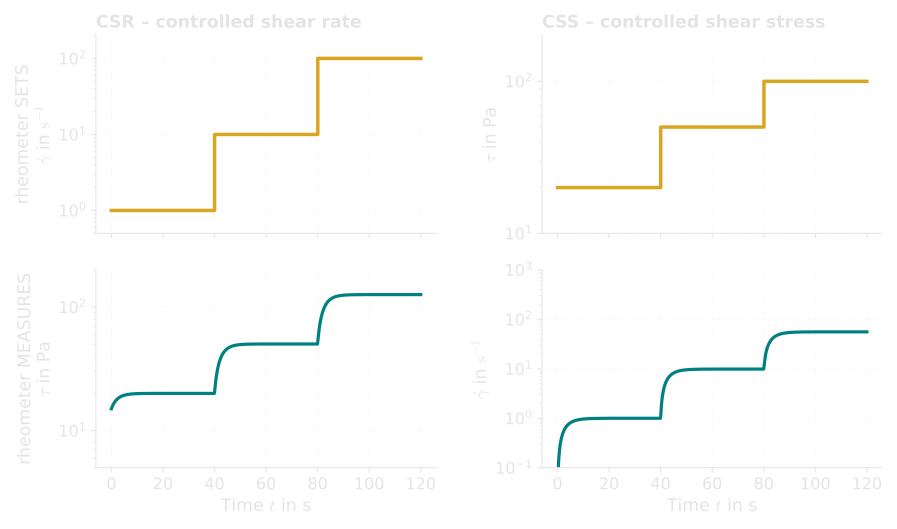
What to look for: the goldenrod curves are what the instrument imposes, the teal curves are the material’s answer. After each step the answer needs a moment to settle into a steady value.
| Mode | Rheometer sets | Rheometer measures | Best for |
|---|---|---|---|
| CSR – controlled shear rate | speed → | torque → | Simulating processes with a defined speed: pumping, stirring, coating |
| CSS – controlled shear stress | torque → | speed → | Behavior near rest: yield stress, creep, viscosity at rest |
A simple way to remember it: CSR asks “how hard do I have to push to move it this fast?”, CSS asks “how fast does it move if I push this hard?”. CSS is the natural choice for materials that should not flow under small forces, such as ketchup or a paint film on the wall.
Measuring Geometries: Cone, Plate and Cylinder
The measuring geometry determines how torque and speed translate into stress and shear rate. Three shapes are standard:
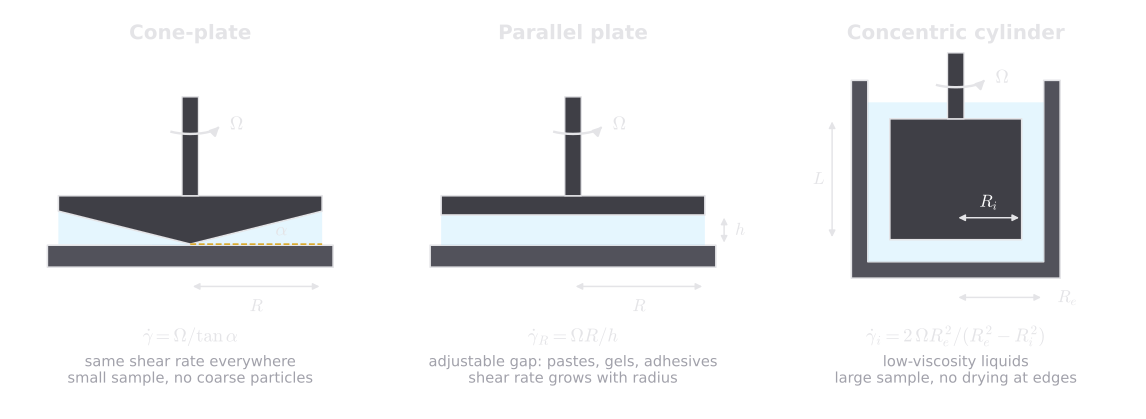
What to look for: in all three cases the sample (tinted blue) sits in a narrow gap between a rotating part (dark gray) and a fixed part (lighter gray). The cone angle is drawn much larger than in reality – real cones have angles of about 0.5° to 2°.
| Geometry | Shear rate | Shear stress | Strengths and limits |
|---|---|---|---|
| Cone-plate | Same shear rate everywhere in the gap; small sample; not suited for coarse particles | ||
| Parallel plate | Adjustable gap: good for pastes, gels, adhesives; shear rate grows from center to rim | ||
| Concentric cylinder | Low-viscosity liquids; large sample volume; little evaporation |
In words: in a cone-plate system, the gap grows in proportion to the distance from the center – and so does the local speed. Both effects cancel, which gives the same shear rate everywhere. That is why the cone is the favorite geometry for non-Newtonian liquids. In a parallel-plate system, the gap is the same everywhere, but the speed grows toward the rim; the formula refers to the rim, and for non-Newtonian samples the stress formula needs a correction (Weissenberg–Rabinowitsch), which modern rheometer software applies automatically.
Worked example. A cone with rad and radius mm turns at rad/s. The shear rate is . If the motor needs a torque of mN·m, the shear stress is Pa – and the viscosity is Pa·s.
In the lab – choosing the geometry: Use a cone-plate for homogeneous liquids and emulsions, parallel plates for pastes, gels, filled systems and adhesives (the gap should be at least ten times the largest particle), and concentric cylinders for thin liquids such as beverages or dilute solutions. For pastes that tend to slip, choose roughened or profiled surfaces.
Flow Curves and Viscosity Curves
A measurement typically runs through a series of shear rates, for example from to . The result can be plotted in two ways that contain exactly the same information.
The flow curve shows shear stress against shear rate on linear axes:
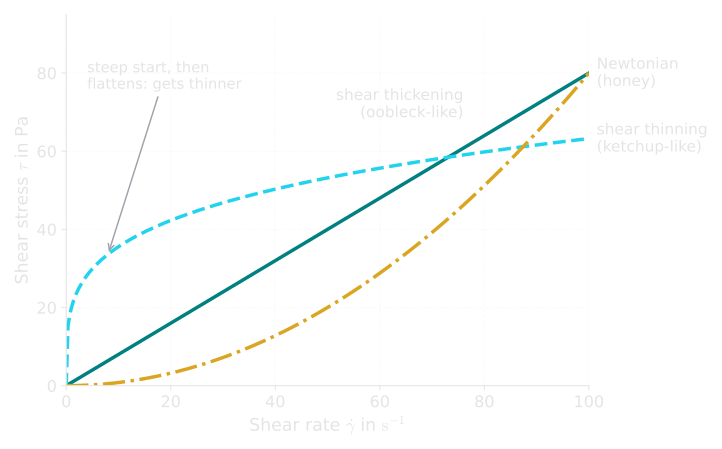
What to look for: only the Newtonian liquid gives a straight line. For the shear-thinning material, each extra unit of shear rate costs less and less stress; for the shear-thickening material, more and more.
The viscosity curve shows viscosity against shear rate – almost always on logarithmic axes, because viscosity and shear rate often span many powers of ten:
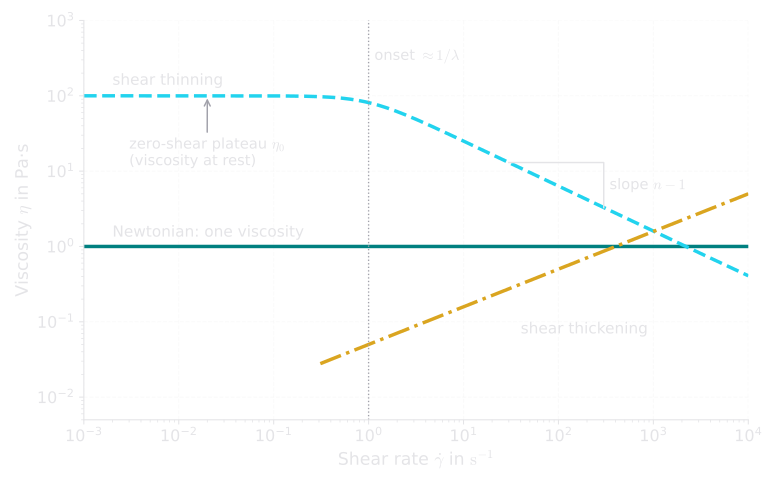
What to look for: the shear-thinning curve has a clear anatomy – a plateau at low shear rates, a bend, and a straight sloping section. We will describe exactly this shape with a formula in a moment.
Reading a viscosity curve is simple once you know what to look for:
- Flat = Newtonian: the viscosity does not depend on the shear rate.
- Falling = shear thinning: the faster, the thinner.
- Rising = shear thickening: the faster, the thicker.
Many shear-thinning materials show a plateau at very low shear rates. This zero-shear viscosity is the “viscosity at rest”: it controls slow processes such as settling of particles, sagging of a coating or the slow creep of an adhesive.
Quick check: A paint has a viscosity of 10 Pa·s at and 0.2 Pa·s at . Is it shear thinning or shear thickening, and why is that useful? Answer: shear thinning – it is thick at rest, so it does not drip, and thin under the brush, so it spreads easily.
Why Materials Get Thinner – or Thicker
The reason for shear thinning and shear thickening lies in the microstructure: the tiny building blocks inside the material and how they arrange themselves in a flow.
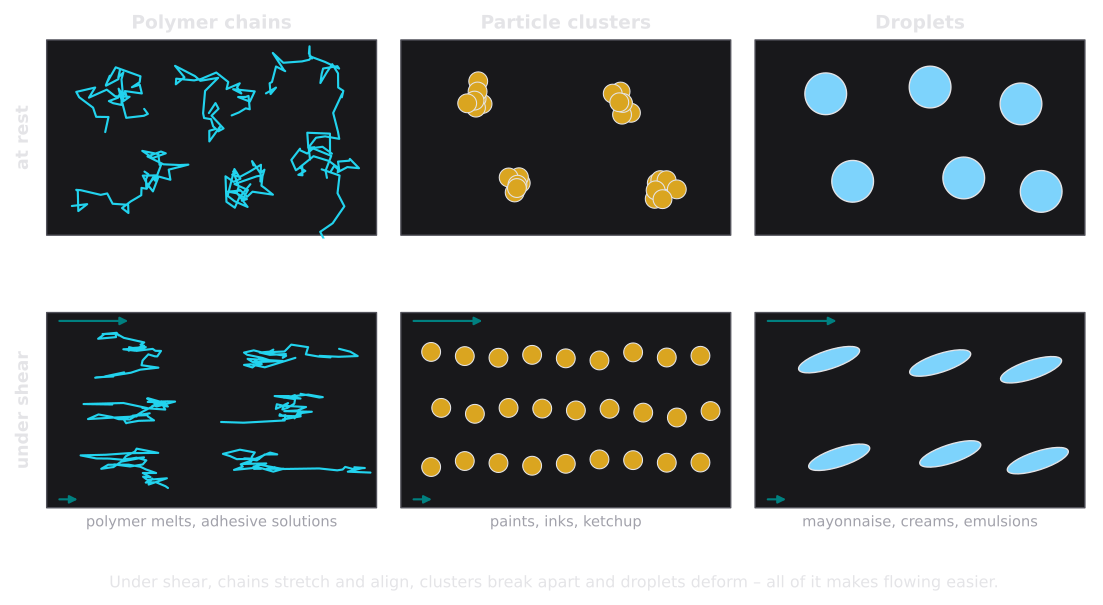
What to look for: at rest, the structures are tangled, clustered or round. Under shear, they stretch, separate and line up with the flow – which makes it easier for the layers to slide past each other.
- Polymer chains (in melts, adhesive solutions, shampoo) are tangled like cooked spaghetti at rest. In a flow they stretch, disentangle and align – they get in each other’s way less.
- Particle clusters (pigments in paint, tomato pieces in ketchup) hold liquid trapped between them at rest. Shear breaks the clusters apart and releases this liquid.
- Droplets (in mayonnaise, creams, emulsions) are round at rest and deform into elongated shapes that slide past each other more easily.
Shear thickening has a completely different cause:
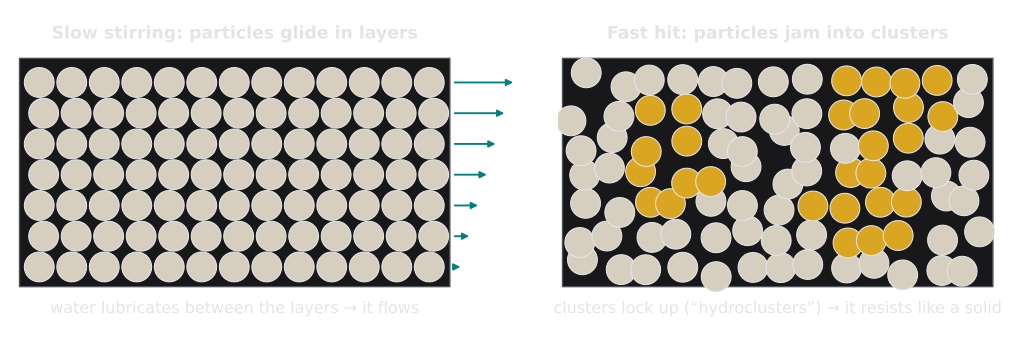
What to look for: at low speed, water acts as a lubricant between the particle layers. At high speed, the particles are pressed together faster than the water can escape, and they lock into clusters.
In oobleck, the cornstarch grains fill about half of the volume. When moved slowly, each grain is surrounded by a thin water film and the grains glide past each other. When hit suddenly, the grains are pushed together into clusters – often called hydroclusters – that jam and resist like a solid. Shear thickening is therefore typical for very concentrated suspensions: wet sand, some ceramic slurries, special protective materials.
Everyday example – why ketchup needs a shake: Ketchup shows an extreme form of shear thinning: below a certain stress it barely flows at all. This threshold is called the yield stress. When the bottle is upside down, the weight of the ketchup is not enough to exceed it. A shake produces a short, strong stress – the structure breaks, the viscosity drops by a factor of a hundred or more, and the ketchup runs. We will look at yield stresses in detail in Part 7.
Describing Curves with Models
Measured curves are often summarized by a few parameters. This makes materials comparable and allows calculations, for example of pumping pressures or coating thickness. Three models are used most often.
The Power Law
The simplest description of a shear-thinning or shear-thickening material is the power law (Ostwald–de Waele model):
In words: the consistency (unit ) is the viscosity at a shear rate of . The flow index (no unit) describes how strongly the viscosity changes: means shear thinning, Newtonian, shear thickening. On log-log axes the power law is a straight line with the slope .
Worked example. A ketchup-like material with and has a viscosity of Pa·s at . At – a firm shake – it is only Pa·s: about 30 times thinner.
The power law has one weakness: at very low shear rates it predicts an ever-growing viscosity, because it knows nothing about the plateau at rest.
Cross and Carreau–Yasuda: Plateau Included
Two models describe the complete S-shaped curve. The Cross model:
and the Carreau–Yasuda model:
In words: both models start at the zero-shear viscosity (the plateau at rest), bend down at a shear rate of about – where is a characteristic time of the material (unit s) – and end at a lower plateau at very high shear rates. In between, the Carreau–Yasuda model follows a power law with the flow index , and the parameter controls how sharp the bend is ( gives the classic Carreau model). in the Cross model plays a similar role to .
The time is a first glimpse of an idea that will run through the whole series: materials have their own internal time scales. If you shear faster than the structure can reorganize (), the viscosity starts to drop.
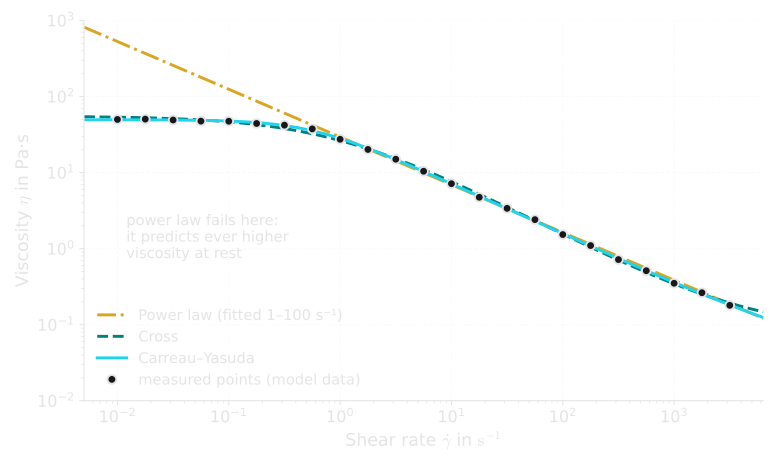
What to look for: in the middle, all three models agree. At low shear rates only Cross and Carreau–Yasuda capture the plateau – the power law “shoots off” into unrealistically high viscosities (model data).
Common pitfall – extrapolating a power law: A power law fitted between 1 and says nothing about the viscosity at rest. Using it to predict sedimentation or sagging, which happen at to , can overestimate the viscosity by orders of magnitude. For slow processes, always measure down to the plateau or use a model that contains .
For materials with a yield stress, such as ketchup, toothpaste or mayonnaise, the Herschel–Bulkley model adds a threshold to the power law:
In words: the material only flows once the stress exceeds the yield stress ; above it, it behaves like a power-law fluid. With this becomes the Bingham model.
When Time Matters: Thixotropy and Rheopexy
So far, the viscosity depended on how fast a material was sheared. For some materials it also depends on how long.
- Thixotropy: under constant shear, the viscosity decreases with time because an internal structure breaks down. At rest, the structure rebuilds and the viscosity recovers with time. Wall paint, yogurt, hair gel, drilling muds and many adhesives and sealants are thixotropic.
- Rheopexy: the opposite – the viscosity increases under shear with time. It is rare and occurs, for example, in some gypsum pastes and protein solutions.
The Hysteresis Loop
A classic test for thixotropy is the hysteresis loop: the shear rate is increased steadily from zero to a maximum and then decreased again.
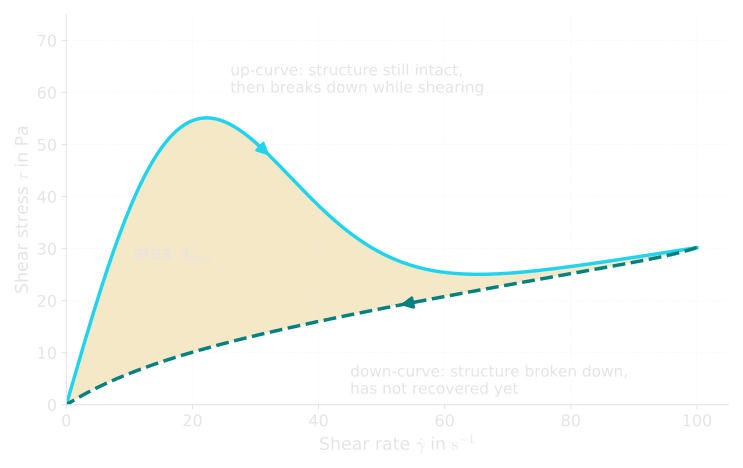
What to look for: on the way up, the structure is still intact and the stress is high; while shearing, it breaks down. On the way back, the structure has not had time to rebuild, so the down-curve lies lower. The shaded area is a measure of thixotropy (model data).
The area between the two curves,
has the unit , which is the same as – energy per second and volume used to break the structure. The loop is quick and intuitive, but its area depends on how fast the ramps are run and on how the sample was treated before. It is therefore only suitable for comparing samples measured with exactly the same method.
The Three-Interval Thixotropy Test (3ITT)
A more meaningful test imitates the real application in three steps:
- At rest: a low shear rate measures the viscosity of the intact structure.
- Application: a high shear rate breaks the structure down – like brushing, spraying or pumping.
- At rest again: the low shear rate is restored, and the rheometer records how fast the viscosity recovers.
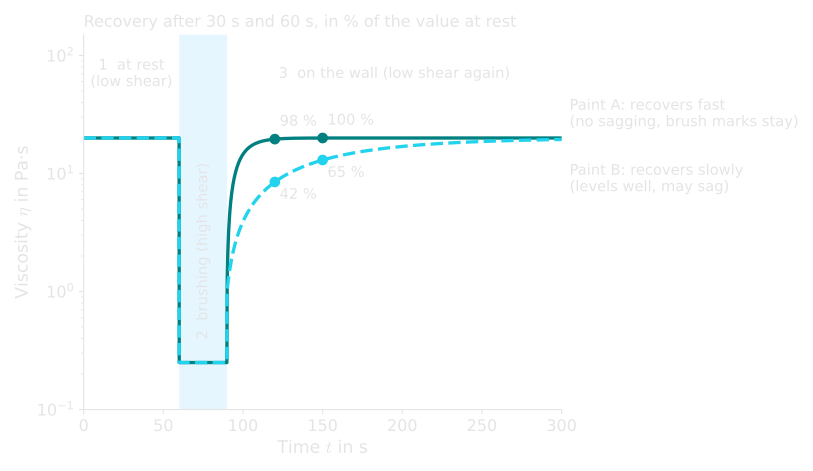
What to look for: both paints thin out equally while brushing. The difference lies in the recovery: after 30 s, Paint A has almost completely recovered, Paint B only to 42 % (model data).
The result is expressed as the recovery in percent of the initial viscosity after defined times, for example after 30 s and 60 s. Neither fast nor slow recovery is “better” – it depends on the application. Fast recovery prevents sagging on vertical walls, but brush marks remain visible. Slow recovery gives the paint time to level out into a smooth film, but on a vertical surface it may sag.
Common pitfall – shear thinning is not thixotropy: Both make a material thinner under shear, but for different reasons. Shear thinning depends on the shear rate and reacts almost instantly: shear faster, it is thinner; shear slower, it is thicker again. Thixotropy depends on time: the structure needs time to break down and time to rebuild. Many materials, like paint, show both effects at once.
Putting It Together: The Life of a Paint
All the concepts of this article can be seen in one everyday product. A wall paint experiences very different shear rates during its life – and needs a different viscosity at each stage:
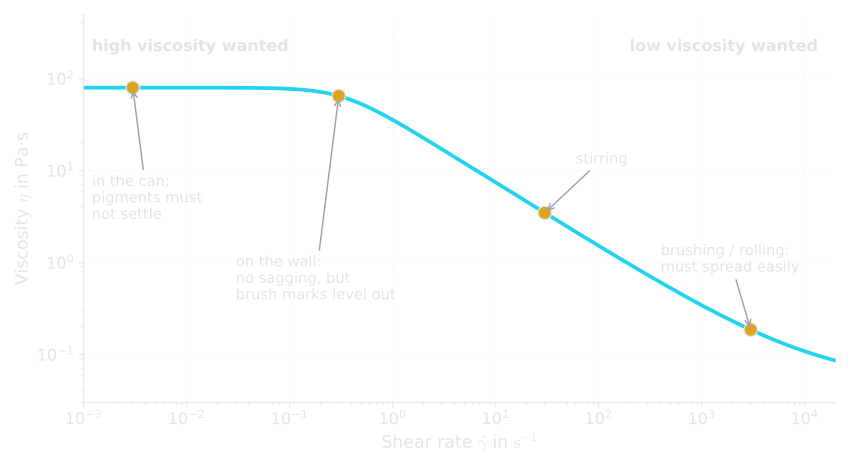
What to look for: the same curve delivers high viscosity where it is wanted (storage, on the wall) and low viscosity where it is needed (brushing). This is shear thinning put to work.
Paint formulators tune exactly this curve – with thickeners, particle size and additives – so that the paint does not settle in the can, spreads easily, levels out smoothly and does not run down the wall. Thixotropy adds the right recovery time on top.
Why It Matters for Adhesives
Many pressure-sensitive adhesives are produced as solutions of acrylic polymers in solvents and coated onto films or paper at high speed – up to and more at the coating head. Their viscosity curve decides whether the coating is even, whether it forms streaks, and how thick the adhesive layer becomes. Adhesive solutions are typically shear thinning, just like the polymer example in this article.
After drying, the solvent is gone and the adhesive is no longer a simple liquid. But one quantity from this article stays important: the viscosity at rest . It determines how easily an adhesive creeps under a constant load – for example, how long a tape can hold a weight. We will measure exactly that in Part 5, and it becomes one of the axes of the Chang Viscoelastic Window in Part 8.
Key Takeaways
- A rotational rheometer measures torque and rotational speed; the measuring geometry turns them into shear stress and shear rate.
- CSR sets the speed (process simulation), CSS sets the stress (behavior near rest, yield stress, creep).
- Cone-plate gives the same shear rate everywhere, parallel plates suit pastes and adhesives, concentric cylinders suit thin liquids.
- Most real materials are shear thinning; dense suspensions can be shear thickening. The reasons lie in their microstructure.
- Viscosity curves belong on log-log axes. The Carreau–Yasuda model describes the plateau at rest, the bend and the power-law region with physically meaningful parameters.
- Shear thinning depends on rate, thixotropy depends on time. The three-interval test measures how quickly a structure recovers.
Key Terms
| Term | Meaning in plain language | Symbol, unit |
|---|---|---|
| Torque | How hard the motor twists the geometry | , N·m |
| Angular velocity | How fast the geometry turns | , rad/s |
| CSR / CSS | Rheometer sets shear rate / sets shear stress | – |
| Flow curve | Shear stress plotted against shear rate | |
| Viscosity curve | Viscosity plotted against shear rate, usually log-log | |
| Shear thinning | Viscosity decreases with increasing shear rate | – |
| Shear thickening | Viscosity increases with increasing shear rate | – |
| Zero-shear viscosity | Viscosity at rest (plateau at low shear rates) | , Pa·s |
| Consistency, flow index | Parameters of the power law | , ; , – |
| Yield stress | Stress below which a material hardly flows | , Pa |
| Thixotropy | Time-dependent breakdown under shear and recovery at rest | – |
| Rheopexy | Time-dependent increase of viscosity under shear | – |
Coming Up Next
So far we have looked only at flow – at materials that turn work into heat like the dashpot. But a rubber band behaves completely differently: it stretches, stores the energy and snaps back. In Part 3 we look at purely elastic behavior, the shear modulus and the spring – the second building block we need to understand viscoelastic materials such as adhesives.
References
- Mezger, T. G.: The Rheology Handbook, 5th ed., Vincentz Network, Hanover 2020.
- Macosko, C. W.: Rheology: Principles, Measurements, and Applications, Wiley-VCH, New York 1994.
- Barnes, H. A.: Thixotropy – a review, Journal of Non-Newtonian Fluid Mechanics 70 (1997) 1–33.
- Cross, M. M.: Rheology of non-Newtonian fluids: a new flow equation for pseudoplastic systems, Journal of Colloid Science 20 (1965) 417–437.
- Yasuda, K.; Armstrong, R. C.; Cohen, R. E.: Shear flow properties of concentrated solutions of linear and star branched polystyrenes, Rheologica Acta 20 (1981) 163–178.
- ISO 3219-2:2021 – Rheology – Part 2: General principles of rotational and oscillatory rheometry.